- Welcome to Probe Software Users Forum.

EPMA Software Designed By Users For Users
 Before making a new topic, please check that a relevant topic does not already exist by using the Search feature
Recent posts
#1
EPMA Laboratory Planning and Design / Re: Planning and Design of Ins...
Last post by John Donovan - June 12, 2026, 08:50:27 AMA colleague of ours said: "An MRI instrument producing a 5 gauss field outside the instrument is being located 10 to 15 meters away my lab. Could this be a beam stability issue for my field emission microprobe?"
I asked Google and it said:
Yes, this could absolutely cause a severe beam stability issue. Even though a 5 Gauss static field is completely safe for human health, it is hundreds to thousands of times stronger than what a field emission microprobe (FE-EPMA) can tolerate. [1]
If the MRI's 5 Gauss safety line is located 10 to 15 meters away from your lab, the residual magnetic field inside your lab will still completely overwhelm your instrument. [1]
------------------------------
## The Field Strength Disconnect
* Your Instrument's Limit: Field emission microprobes typically require a maximum AC/DC stray magnetic field baseline of 0.3 milligauss (0.03 µT) to 1.0 milligauss to prevent electron beam deflection, drift, or image distortion.
* The MRI's Output at Distance: If the 5 Gauss (5,000 milligauss) boundary is located 10 to 15 meters away, the magnetic field will continue to decay via the inverse-cube law ($1/r^3$) as you move deeper into your lab:
* 1 meter beyond the 5 Gauss line: ~4,200 milligauss
* 5 meters beyond the 5 Gauss line: ~1,500 milligauss
* 10 meters beyond the 5 Gauss line: ~600 milligauss [1]
Even if your microprobe is placed 10 meters past the 5 Gauss line, a residual static field of several hundred milligauss will cause severe, permanent beam deflection and alignment issues.
------------------------------
## The Hidden Danger: Dynamic Fields
While a constant, unchanging static (DC) magnetic field can sometimes be calibrated out by adjusting the microprobe's internal alignment coils, the real threat comes from dynamic fields:
* Patient Table & Cryocooler Movement: As the MRI table moves or the internal cooling pumps cycle, the static field shifts slightly, causing your electron beam to drift randomly.
* Active Gradient Pulses: When the MRI is actively scanning a patient, it fires powerful electromagnetic gradient coils. These produce rapidly changing AC magnetic fields. These dynamic AC spikes will slip straight through most standard instrument shielding, causing the electron beam to vibrate, which manifests as severe image blur, erratic probe currents, or a complete loss of analytical spatial resolution. [2]
------------------------------
## Necessary Mitigation Steps
If this installation is finalized, you must proactively implement facility-level mitigation strategies:
* Request an Isogauss Plot: Ask the MRI facility manager for the system's exact vendor-provided 0.1 Gauss (100 milligauss) and 0.01 Gauss (10 milligauss) isogauss maps to plot exactly how the field interacts with your room's blueprint. [3]
* Install an Active Magnetic Cancellation System: You will likely need to install a triaxial active cancellation system (such as those from Spicer Consulting or [Macnetic Shielding](https://www.magneticshield Corp)) around your microprobe column. These systems use sensor arrays and counter-coils to dynamically push the ambient field back down to < 0.3 milligauss in real-time.
* Room-Level Shielding: Ensure the MRI room features comprehensive silicon steel or mu-metal passive shielding built directly into its walls to constrain the fringe field closer to the scanner bore. [3]
If you can find out whether the MRI is a 1.5T, 3T, or 7T system, or if it is actively shielded, I can help you calculate the exact expected milligauss exposure at your column's precise coordinates. [4, 5]
[1] [https://radiopaedia.org](https://radiopaedia.org/articles/5-gauss-line-1)
[2] [https://pmc.ncbi.nlm.nih.gov](https://pmc.ncbi.nlm.nih.gov/articles/PMC4848040/)
[3] [https://www.aapm.org](https://www.aapm.org/meetings/05AM/pdf/18-2826-36240-327.pdf)
[4] [https://mrimaster.com](https://mrimaster.com/5-gauss-line-in-mri/)
[5] [https://www.bir.org.uk](https://www.bir.org.uk/media/376620/day_2_field_strength_finalr.pdf)
#2
Discussion of General EPMA Issues / Re: The Limits of EPMA Accurac...
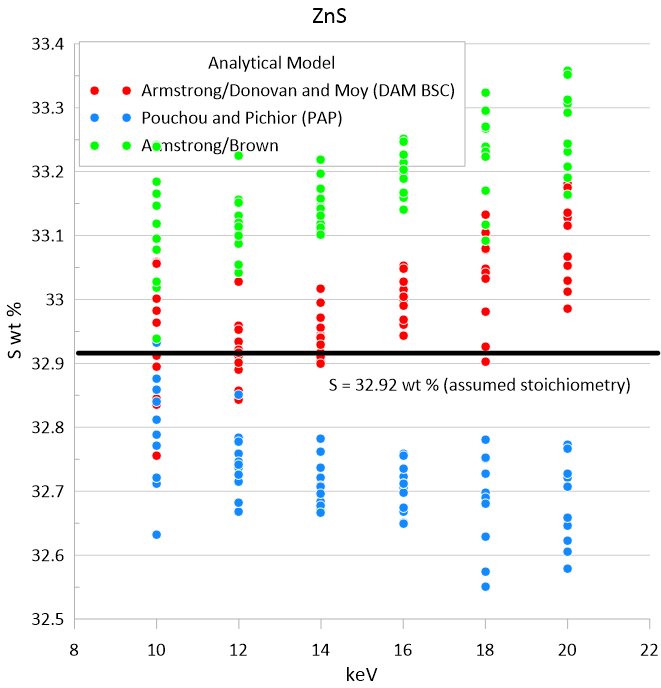
Last post by Probeman - June 10, 2026, 11:16:01 AMHere's a plot of S Ka in ZnS using FeS2 as a primary standard over a range of keVs for three different analytical models:
#3
DTSA II / Re: Measuring FWHM
Last post by Nicholas Ritchie - June 08, 2026, 10:35:59 AMThere isn't an automated way to measure the FWHM of peaks in DTSA-II. The calibration alien will fit spectra to Gaussian peak shapes and modeled backgrounds but it assumes the standard equation for resolution as a function of energy. If the full width of the strobe peak is visible, you can always use the old-school manual method...
#4
Probe for EPMA / Re: Secondary boundary fluores...
Last post by John Donovan - June 08, 2026, 07:30:37 AMQuote from: sem-geologist on June 08, 2026, 04:14:16 AMQuote from: John Donovan on July 26, 2025, 09:04:48 AMAttached below is the poster from Aurelien Moy and I for M&M 2025 for those who are unable to attend. For those who will be present at the meeting, the poster session is Thu morning (10-12).
Looking forward to answering any and all questions.
BTW, this poster is Gold! Every time someone wants to "measure" "diffusion" across boundary with EPMA I just redirect them to that poster. Papers are nice - but to grasp the severeness of effect people need to read them. Poster have much faster direct impact in such cases.
Thank you SG!
For others who have not yet stumbled across this poster it is attached to the reply linked here:
https://smf.probesoftware.com/index.php?topic=1545.msg13549#msg13549
And remember, to see attachments, you must be logged in as a member.
#5
Probe for EPMA / Re: Secondary boundary fluores...
Last post by sem-geologist - June 08, 2026, 04:14:16 AMQuote from: John Donovan on July 26, 2025, 09:04:48 AMAttached below is the poster from Aurelien Moy and I for M&M 2025 for those who are unable to attend. For those who will be present at the meeting, the poster session is Thu morning (10-12).
Looking forward to answering any and all questions.
BTW, this poster is Gold! Everytime someone wants to "measure" "diffusion" across boundary with EPMA I just redirect them to that poster. Papers are nice - but to grasp the severeness of effect people need to read them. Poster have much faster direct impact in such cases.
#6
DTSA II / Measuring FWHM
Last post by Ben Buse - June 08, 2026, 02:08:36 AMIs it possible to measure the FWHM of different peaks in DTSA-II? Would it be possible to measure the FWHM of the strobe peak?
Thanks
Thanks
#7
Discussion of General EPMA Issues / Re: Geopolymer
Last post by Probeman - June 05, 2026, 03:22:09 PMQuote from: Les Moore on June 04, 2026, 07:49:44 PMThanks, I'll sneak up on the structure with low(ish) kV and low current to avoid the Na from running away :=)
Or you could use the TDI scanning method described here:
https://smf.probesoftware.com/index.php?topic=912.0

#8
Discussion of General EPMA Issues / Re: Geopolymer
Last post by Les Moore - June 04, 2026, 07:49:44 PMThanks, I'll sneak up on the structure with low(ish) kV and low current to avoid the Na from running away :=)
#9
Discussion of General EPMA Issues / Re: The Limits of EPMA Accurac...
Last post by Probeman - June 04, 2026, 07:33:08 PMQuote from: AndrewLocock on June 04, 2026, 12:41:54 PMThe recent improvements in Probe-for-EPMA are impressive, particularly in the areas of matrix corrections, background fitting and the resultant accuracy.
However, I suggest that matrix matching, where possible can still provide slight improvements in accuracy.
Thanks! It would also be nice to see some percent relative errors for these analyses...
Yes, I completely agree that "matrix matching" ones standard to ones unknown, can minimize the matrix correction. But the real problem I think that so called "matrix matching" is addressing is not really the matrix correction, but rather it is "count rate matching".
Because using a standard with a similar matrix means the concentrations are probably similar, and therefore the count rates are also similar. Therefore "count rate matching" also minimizes the dead time correction and makes pulse height depression less of an issue, so that helps when count rates differ between the standard and the unknown. This, I think, is the real reason many analysts are selecting a standard with a similar matrix to their unknown!
The other problem is whether the "matrix matched" standard one selects is actually what it is claimed to be. For example, is the assumed stoichiometry of pyrrhotite actually what it is? We know that the natural San Carlos olivine (even when sourced from the Smithsonian) has a significantly variable composition as reported by John Fournelle and others. Which we suspect explains why various EPMA labs around the world report reproducible intra-lab results, but consistently different inter-lab results (see Wieser et al, Barometers behaving badly, 2023). So much so that geologists have taken to creating laboratory "correction factors" for each lab! Is this really what we want?
https://smf.probesoftware.com/index.php?topic=1831.msg13974#msg13974
What we need are globally distributed high purity end member synthetic minerals, but also have our instrument well calibrated so they can handle standards and unknowns with very different count rates.
Look, I get it. If one performs the dead time, Bragg order k-ratio calibrations and the PHA integral-baseline tuning method I have suggested in this topic, one could use high purity synthetic MgO as a Mg Ka standard for analyzing olivines, but one could also use a high purity synthetic Mg2SiO4. And you know what? Both will be included in the FIGMAS mount that Will Nachlas is putting together with support from MAS. Because then we can measure k-ratio consensus (consensi?) between labs, once these mounts are distributed globally!
As stated above, the real reason I think that many users find "matrix matched" standards to be superior, is because they are actually "count rate matching" to their unknowns. Why is this? Because their dead time constants are not calibrated properly and they are not using the integral baseline PHA tuning method (described above) to obtain a linear response from their electronics. So they *have* to use "count rate matched" standards, even when we know they are heterogeneous from grain to grain.
Does anyone remember when Gene Jarosewich said that if you use the Smithsonian mineral standards you should average at least 10 grams for standardizing to obtain an accurate comparison to his wet chemistry? Does *anyone* do that? No, they use their "favorite" grain...
The more important question is, have they run the constant k-ratio dead time calibration method on their instruments? Probably not. See the pdf in the Help menu of Probe for EPMA and here:
https://smf.probesoftware.com/index.php?topic=1466.msg11102#msg11102
Have they checked their effective take off angles? (Though probably not a major issue for Fe ka!) See the pdf in the Help menu of Probe for EPMA and here:
https://smf.probesoftware.com/index.php?topic=1739.0
Also, have they tried the integral baseline PHA tuning method? Again see the pdf in the Help menu of the latest Probe for EPMA version as discussed in the post above. This integral baseline PHA tuning method allows one to have vastly different count rates between their standard and their unknown and still achieve ~1% relative accuracy. For example:
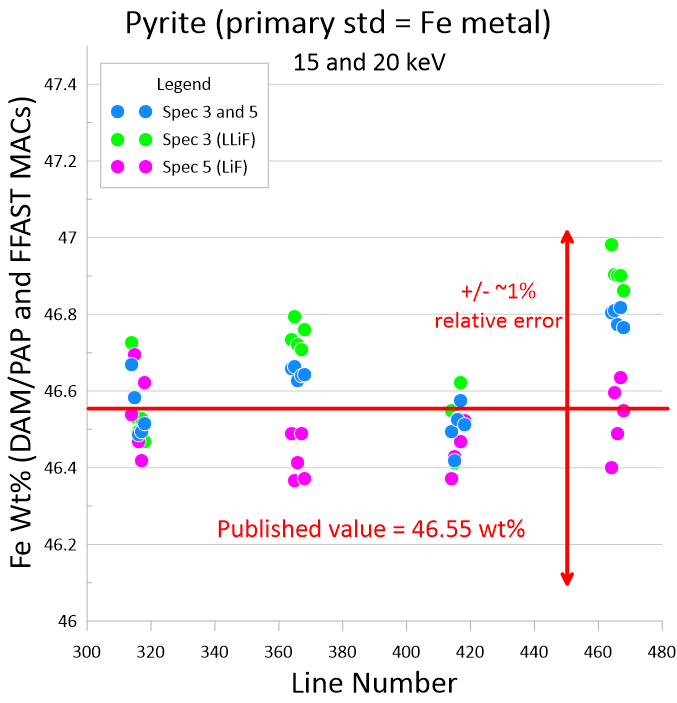
Yes, the new backscatter loss matrix correction method works really well, as do the FFAST MACs, but these are just part of the problem of why different labs are consistently reporting different results for the same materials and I think "matrix matched" heterogeneous natural standards is part of the problem.
Let's start with some k-ratio calibrations and get this sorted out by "failure" testing our instrument calibrations by extrapolating from a high purity synthetic primary standard to a much different secondary standard. Fe metal to pyrite might be good if we can assume the pyrite material is stoichiometric.
MgO to NIST glass is another good extrapolation... I've posted many other examples in this topic.
#10
Discussion of General EPMA Issues / Re: Latest version changes for...
Last post by AndrewLocock - June 04, 2026, 12:41:54 PMThe recent improvements in Probe-for-EPMA are impressive, particularly in the areas of matrix corrections, background fitting and the resultant accuracy.
However, I suggest that matrix matching, where possible can still provide slight improvements in accuracy.
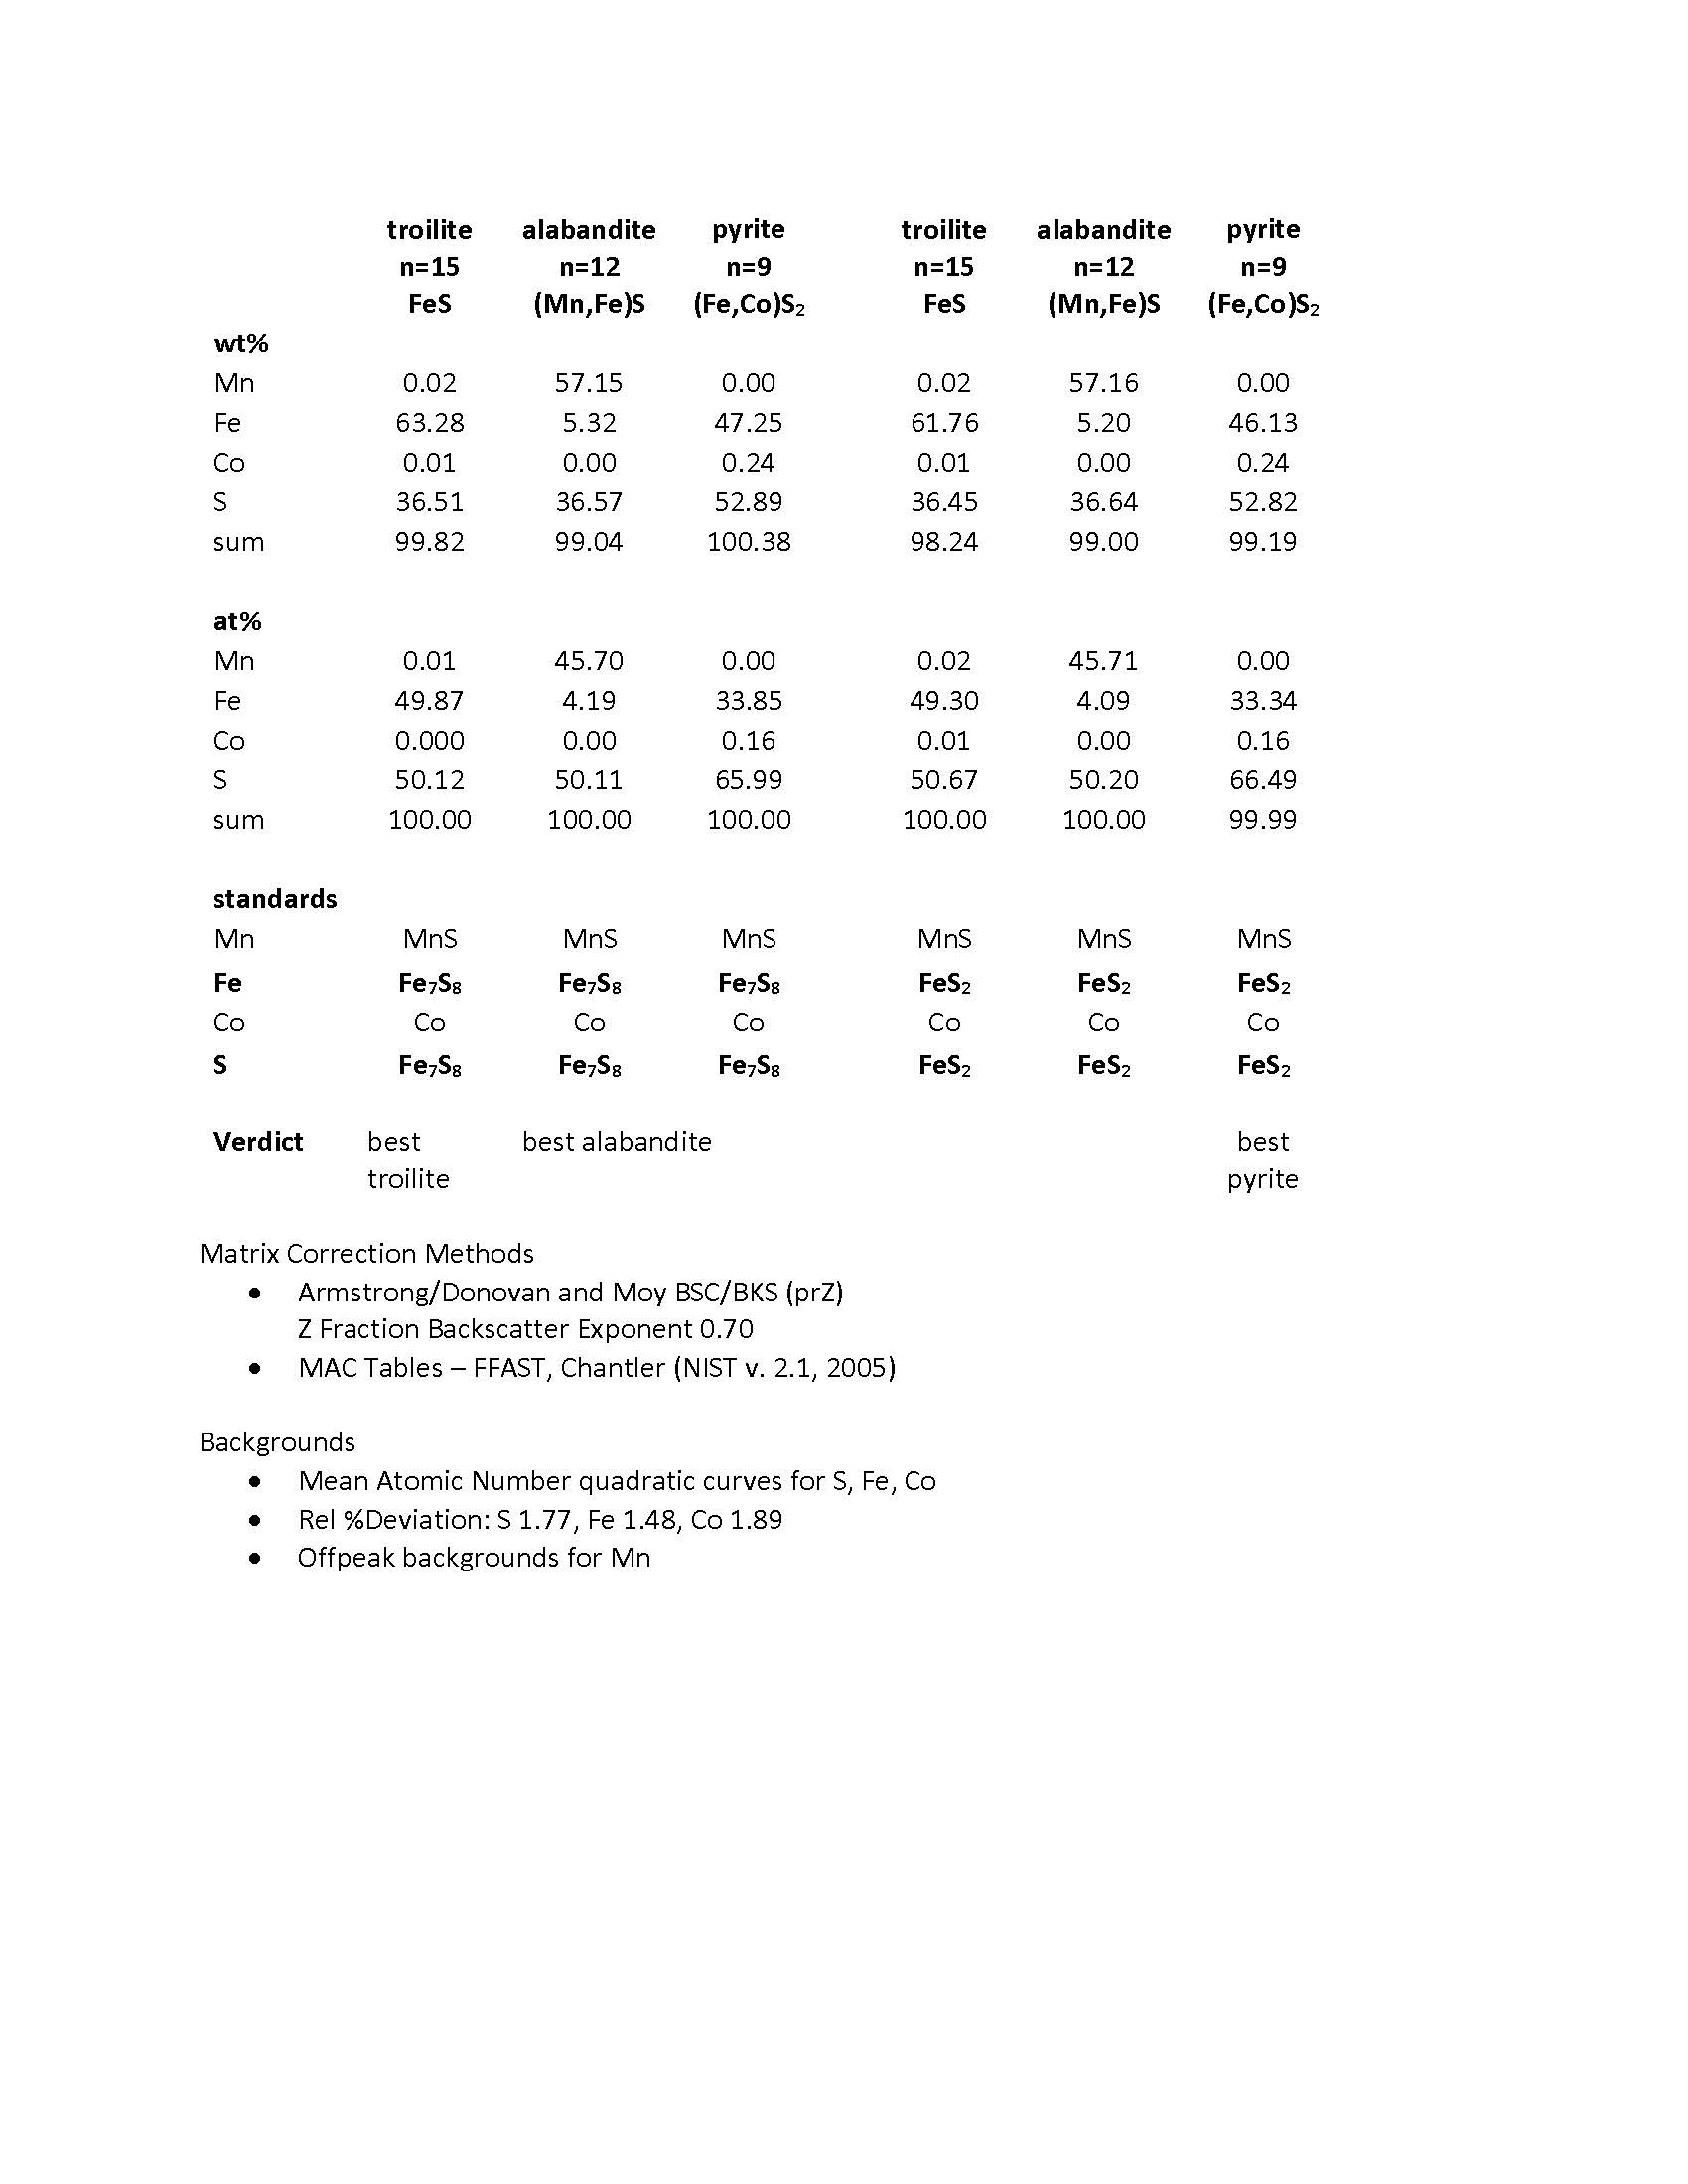
As an example I provide actual average analyses of troilite, alabandite, and pyrite, using two different standards for the Fe and S - pyrrhotite (Fe7S8) and marcasite (FeS2).
(or attached PDF)
For troilite and alabandite, the Fe & S standard that gives the best results is pyrrhotite.
(Admittedly, the differences for alabandite are trivial).
Whereas for pyrite, the Fe & S standard that gives the best results is marcasite.
In these analyses, it is iron that is most affected by the choice of standard.
Because of this behavior, matrix matching for Fe is still an improvement in this system.
Cheers, Andrew
However, I suggest that matrix matching, where possible can still provide slight improvements in accuracy.
As an example I provide actual average analyses of troilite, alabandite, and pyrite, using two different standards for the Fe and S - pyrrhotite (Fe7S8) and marcasite (FeS2).
(or attached PDF)
For troilite and alabandite, the Fe & S standard that gives the best results is pyrrhotite.
(Admittedly, the differences for alabandite are trivial).
Whereas for pyrite, the Fe & S standard that gives the best results is marcasite.
In these analyses, it is iron that is most affected by the choice of standard.
Because of this behavior, matrix matching for Fe is still an improvement in this system.
Cheers, Andrew